Non-linear catalyst deactivation through explainable artificial intelligence
In this study, traditional machine learning models were developed using Pandas, NumPy, and Scikit-learn to predict catalyst performance. Additionally, deep learning models were constructed using TensorFlow to achieve the same predictive goal.
Data preprocessing
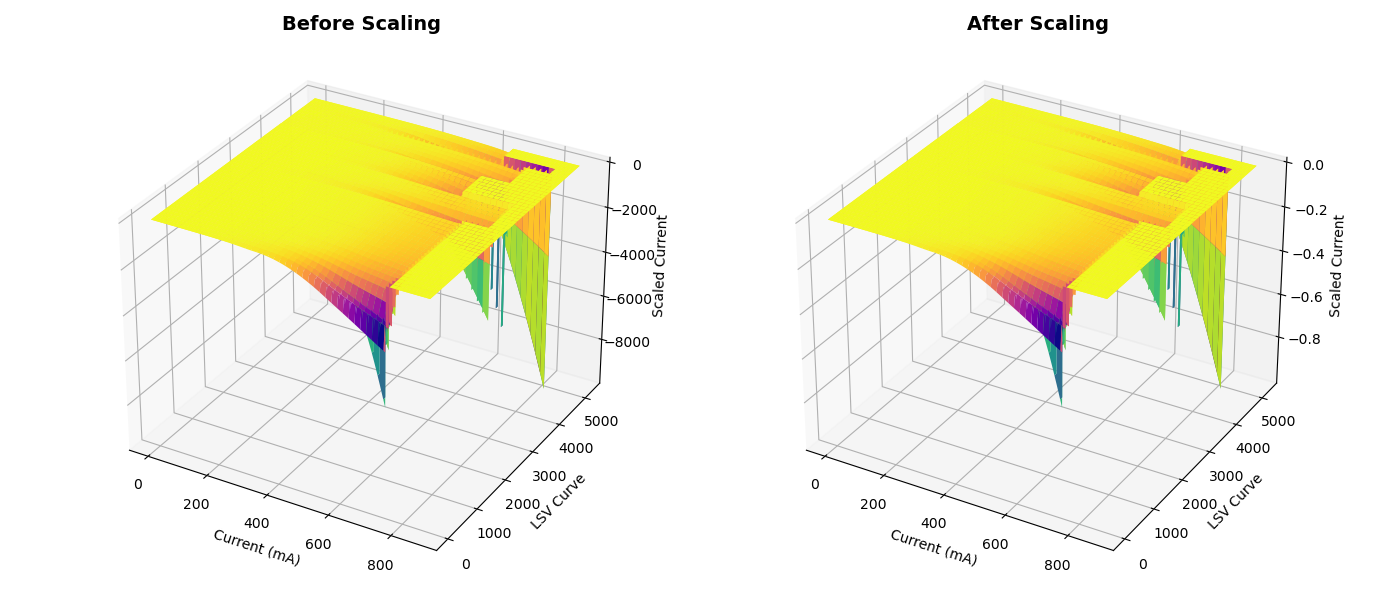
Experimentally obtained data often come in non-uniform formats.To address the non-uniformity of data formats, we developed a pre-processing pipeline using scikit-learn. Initially, the time intervals between data points, where the current values of the LSV curves were recorded, varied with each operating condition, resulting in measurements at different voltage intervals. To standardize these intervals, we employed the ‘interp1d’ function from the Scipy Python package to fit the curves and subsequently re-extracted the current values at uniform 0.0025 V intervals.Furthermore, the highest potentials of the LSV curves ranged from -3.0 to -3.4 V, resulting in vector lengths varying between 1199 and 1359. This issue was resolved by applying zero-padding to extend all LSV curves to the maximum operating voltage of -3.4 V. Consequently, the entire dataset was standardized with a vector length of 1359 and a voltage interval of 0.0025 V. Each target was standardized by centering the mean at zero and scaling to a consistent variance, ensuring comparable value ranges across the three targets. Additionally, all LSV data were normalized by dividing by the maximum value, so the input pixel values ranged between 0 and -1. A stratified training-validation-test split was performed to maintain the distribution of catalyst types. For each operating condition, 20% of the data was randomly selected for the test set, followed by an 80/20 split of the remaining data into training and validation sets. This procedure was repeated for each operating condition, and the final train, validation, and test datasets were compiled by integrating the respective sets from all conditions.
Before and after scaling
Key Goals
Explainable Predictive Modeling: Create an AI model that forecasts catalyst behavior and process outcomes, reducing the reliance on extended experimental tests. This model will offer clear explanations for its predictions, making them accessible to experts in the field.
Pattern Recognition: Employ machine learning techniques to extract meaningful insights from experimental data, which will aid in predicting the lifespan of catalysts and identifying the factors that contribute to their degradation.
Root Cause Analysis: Use AI to conduct a thorough analysis of complex data to pinpoint the primary reasons for catalyst degradation. The findings will assist in the development of strategies to prevent or minimize degradation.Decision Support: Develop an AI-based support system that can evaluate the effects of different operational variables on the stability of catalysts and the selectivity of the production process.
My conclusion on the results is that the outcome provides good insight onto further research that needs to be done. The results show that there are some underlying stats that provide insight into what makes a player a starter. But it would be best practice to build out a model to compare this model against that would break down the players by position (or at least by front court and back court). This would require more data (at least the past 5 years, possible the past 10) to get adequate sample size.
What I learned
In future models and a revision of this model I need to find ways to incorporate more data. Having only one season of data resulted in 148 starters and 248 backups after filtering players out for lack of games played and lack of minutes per game (sample size issues). Using the previous 5 seasons of player data would have provided a much better sample size while also having the parameters of the game kept relatively the same (i.e., not a lot of rule changes or dramatic difference in style of play). To make this model work for a single season, I made sure to use cross-validation. However, it would have been better to use both cross validation and multiple seasons of data.